Read DevOps Weekly - DevOpsLinks
DevOps Weekly Newsletter, DevOpsLinks. Curated DevOps news, tutorials, tools and more!
Join thousands of other readers, 100% free, unsubscribe anytime.
Join us
DevOps Weekly Newsletter, DevOpsLinks. Curated DevOps news, tutorials, tools and more!
Join thousands of other readers, 100% free, unsubscribe anytime.
Disclaimer: This blog post was written as part of a collaboration withLightrun. The Rise of Generative AI and the Fall of Stack Overflow Generative AI, once viewed as a fantasy, a science-fiction tale only manifesting in Hollywood productions, has quickly integrated itself into every aspect of our d..
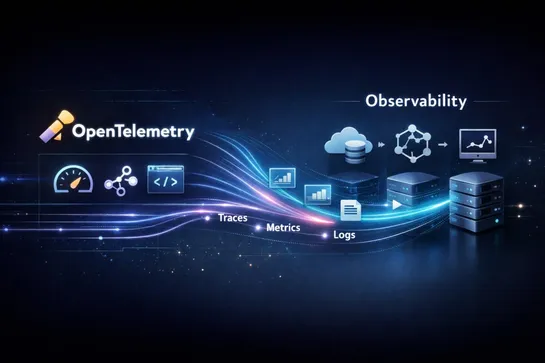
Observability is a critical component of modern software development, providing insights into system performance, availability, and quality. The blog delves into the concept of observability, differentiating it from traditional monitoring.
Key points covered include:
Evolution of observability: From system-centric monitoring to service-focused observability in microservices architectures.
Three pillars of observability: Metrics, logs, and traces, their roles, and popular tools (Prometheus, ELK Stack, Jaeger).
Building a comprehensive observability strategy: Best practices like data centralization, quality, alerting, visualization, correlation, anomaly detection, and continuous improvement.
Challenges: Data volume, complexity, tooling, and skillset requirements.
Overall, the blog emphasizes the importance of observability for understanding system behavior, improving performance, and ensuring reliability.
This blog post provides an overview of observability tools for DevOps engineers and SREs. Observability is essential for understanding system behavior and troubleshooting problems in complex IT infrastructure. The blog explores different categories of observability tools including log aggregation, APM, distributed tracing, time-series databases, and metrics collection. Examples of popular tools in each category are provided along with a brief description of their features. Finally, the blog emphasizes the importance of choosing the right observability tools based on your specific needs and highlights the benefits of implementing a strong observability strategy.
One of the key aspects of VSCode is its ease of extension. So when it comes to debugging, this means users can either use the built-in debugging tools or install debugging extensions to add more features and make their debugging experience richer and more customized to their needs.
In this article, we will explore both approaches: debugging using the built-in tools, as well as using an external extension.
EKS, a widely used managed Kubernetes service, faces challenges in troubleshooting and maintaining applications due to the disconnect between development and production environments. Lightrun, a dynamic observability platform, addresses these issues by providing real-time insights and dynamic instrumentation capabilities, enabling developers to debug and monitor applications seamlessly in EKS clusters.
Log data volumes are increasing for many organizations, making it challenging to identify and resolve user-specific issues efficiently. Traditional logging often fails to meet the demands of this task effectively, and alternatives have emerged as potential solutions to this pressing issue. Lightrun is one of these alternatives that offers conditional logging, allowing developers to log only what's needed and quickly pinpoint the root cause of user-specific issues.
The unprecedented growth of data in recent years has led to a demand for evolution in traditional monitoring practices.
The current observability maturity model is a good solution but needs further augmentations.
The widely accepted model includes the following stages:
1) Monitoring (Is everything in working order?)
2) Observability (Why is it not working?)
3) Full-Stack Observability (What is the origin of the problem, and what are its consequences?)
4) Intelligent Observability (How to predict anomalies and automate response?)
LOGIQ is supporting the next stage in the model i.e, Federated Observability. In other words, data availability for consumers with on-demand convenience.
Observability is what defines a strong SRE team. In this blog, we have covered the importance of observability, and how SREs can leverage it to enhance their business.
How to debug and solve user-specific issues using Lightrun in your IDE in real-time and without redeploying.
Check out our open-source SLO tracker and set up your SLO's so that you can accurately track your error budgets. Automate your SRE, with Squadcast's SLO tool!