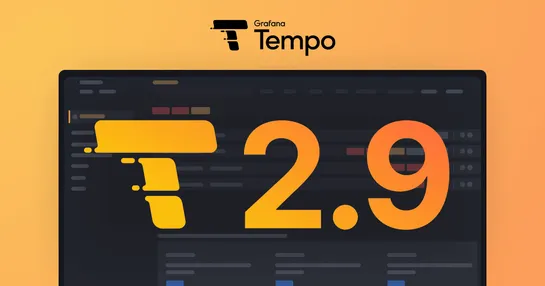
Grafana Tempo 2.9 Supercharges Distributed Tracing with LLM Integration

Grafana Tempo 2.9 debuts with MCP server support and TraceQL metrics sampling, enhancing data analysis and query efficiency.
Join us

Grafana Tempo 2.9 debuts with MCP server support and TraceQL metrics sampling, enhancing data analysis and query efficiency.
👨🚀 ByteVibe, a space out of space 👨🚀 ─ ✅ White or transparent✅ Durable color / long lasting✅ Durable material✅ Vibrant colors✅ Grey adhesive left side for white stickers✅ 100% vinyl with 3M glue✅ Gl...


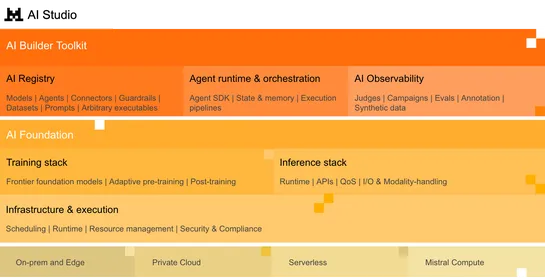
Mistral AI Studio launches to aid enterprise AI teams in moving from prototypes to production with enhanced infrastructure and governance features.

Mirantis releases k0rdent 1.2.0, advancing Kubernetes management with new features, ARM64 support, and improved observability using OpenTelemetry.

It's 2018 in Kubecon North America, a loud echo in the microphone, and then Ben Sigelman is on the stage.
There is conventional wisdom that observing microservice is hard. Google and Facebook solved this problem, right? They solved it in a way that allowed Observability to scale to multiple orders of magnitude to suit their use cases.
The prevailing assumption that we needed to sacrifice features in order to scale is wrong. In other words, the notion that people need to solve scalability problems as a tradeoff for having a powerful set of features is incorrect.
People assume that you need these three pillars of Observability: metrics, logging, and tracing, and all of a sudden, everything is solved. However, more often than not, this is not the case.
Today we are going to discuss Observability and why this is a critical day-2 operation in Kubernetes. Next, we will discuss the problems with Observability and leverage its three pillars to dive deep into some concepts like service level objectives, service level indicators, and finally, service level agreements.


Join us on 20th July at 9 AM PDT for a webinar on Declarative Provisioning and Observability with Pravanjan Choudhury.


The inspiration for this project started from the desire to understand and document terms and concepts related to Observability in one single place... read more

Fluentbit is an open-source log management tool that enables users to gather data from multiple sources, apply filters, and transmit it to compatible destinations.
Vector by Datadog is a data pipeline for observability that offers cost savings, advanced data enrichment, and enhanced data security.
Fluentd is a lightweight log management tool that supports a wide range of data sources and formats with high customizability.
Logstash is a robust logging tool used for managing logs with powerful transformation capabilities.
Syslog-ng offers tamper-proof storage and rapid search capabilities.
LOGIQ.AI provides reliable integration with open-source observability collectors and processors, enabling users to monitor the performance and health of their systems in order to support improved system performance, security, and overall business outcomes.

The DevOps market is projected to hit $20.53 billion by 2026.
With the growing importance of DevOps, comes a growing set of challenges.
Explore the top 5 DevOps challenges related to observability, and how LOGIQ solves them.
The challenges are the complexity of distributed systems, high cardinality of data, siloed monitoring tools, alert fatigue, and real-time analysis and response.
LOGIQ offers a comprehensive observability platform that integrates seamlessly with service meshes and reduces alert noise through automation.


