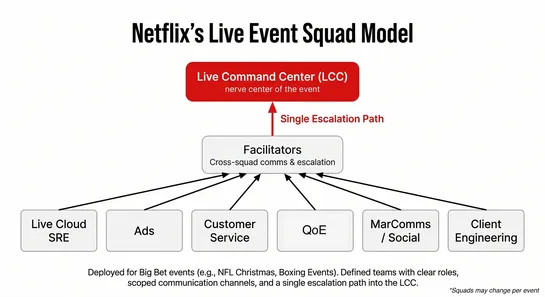
Join us

ContentUpdates and recent posts about Grafana Mimir..
 Activity
@kaptain added a new tool KubeLinter , 3 weeks, 4 days ago.
 Activity
@devopslinks added a new tool Grype , 3 weeks, 4 days ago.
 Activity
@kaptain added a new tool Hadolint , 3 weeks, 4 days ago.
 Activity
@varbear added a new tool Bandit , 3 weeks, 4 days ago.
 Activity
@devopslinks added a new tool JFrog Xray , 3 weeks, 4 days ago.
 Activity
@devopslinks added a new tool OWASP Dependency-Check , 3 weeks, 4 days ago.
 Activity
@varbear added a new tool pre-commit , 3 weeks, 4 days ago.
 Activity
@devopslinks added a new tool GitGuardian , 3 weeks, 4 days ago.
 Activity
@devopslinks added a new tool detect-secrets , 3 weeks, 4 days ago.
 Activity
@devopslinks added a new tool Gitleaks , 3 weeks, 4 days ago.
Grafana Mimir is an open-source distributed time-series database developed by Grafana Labs, designed to store and query Prometheus metrics at massive scale. It provides a horizontally scalable, multi-tenant, and highly available backend that enables organizations to run Prometheus monitoring with virtually unlimited retention and capacity.

Mimir is built for modern observability stacks, offering features like query sharding, data compaction, object storage integration (S3, GCS, Azure Blob), and efficient deduplication for high cardinality workloads. It’s compatible with the Prometheus remote_write and remote_read APIs, making it easy to integrate into existing Prometheus ecosystems.

As part of the Grafana open observability suite, Mimir can be deployed independently or alongside Loki (for logs) and Tempo (for traces) to build a complete, scalable observability platform.