What if your backend is failing but your UI looks perfectly fine?
Struggling with hidden bugs? Learn how application programming interface testing ensures accurate data flow, security, and performance.
Join us

Struggling with hidden bugs? Learn how application programming interface testing ensures accurate data flow, security, and performance.

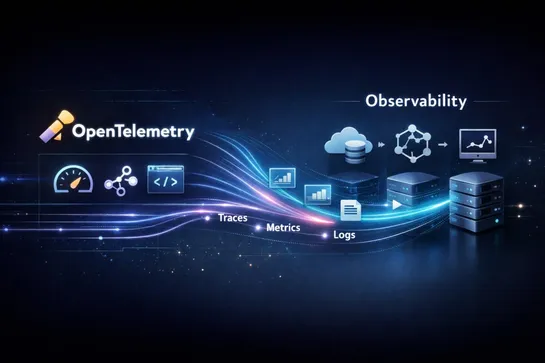
1. OpenTelemetry reduces backend coupling by standardizing how telemetry is generated, described, transported, and processed before it reaches any observability platform.
2. The biggest migration advantage comes from using OpenTelemetry APIs and SDKs, OTLP, and the Collector, which make telemetry pipelines more portable across backends.
3. The Collector is the operational pivot point because it can receive, process, and export telemetry to one or more destinations from a centralized control layer.
4. OpenTelemetry does not eliminate backend migration work, since teams still need to validate dashboards, alerts, queries, retention rules, and other backend-specific workflows.
5. The safest migration approach is incremental: standardize telemetry first, validate both old and new backends, then cut over gradually.
🚀 𝗛𝗲𝗮𝗱𝗶𝗻𝗴 𝘁𝗼 𝗧𝗼𝗸𝘆𝗼 𝗳𝗼𝗿 𝗝𝗮𝗽𝗮𝗻 𝗜𝗧 & 𝗗𝗫 𝗪𝗲𝗲𝗸! 𝗥𝗘𝗟𝗜𝗔𝗡𝗢𝗜𝗗 will be at the 23rd Information Security Expo Spring 2026 from April 8–10 at Tokyo Big Sight – 𝗝𝗮𝗽𝗮𝗻’𝘀 𝗹𝗮𝗿𝗴𝗲𝘀𝘁 𝘀𝗵𝗼𝘄𝗰𝗮𝘀𝗲 𝗳𝗼𝗿 𝗰𝘆𝗯𝗲𝗿𝘀𝗲𝗰𝘂𝗿𝗶𝘁𝘆 𝘀𝗼𝗹𝘂𝘁𝗶𝗼𝗻𝘀. Come see how our advanced ADC and secure application delivery solutions help protect critical infr..

🚢 Maritime Cybersecurity Is Still Too Weak – And the Risks Are Growing As ships become smarter, greener, and more connected, their cyber defenses remain worryingly outdated. 📉 Over 80% of shipowners have faced cyberattacks in the past 3 years 💸 Average cost per attack: $3.1 million 🎣 Phishing causes..

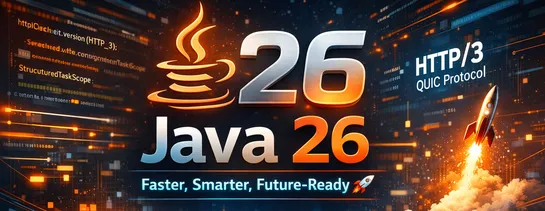
Java 26 (March 2026) is out, and while it’s not a headline-heavy release, it brings meaningful improvements where it counts — performance, networking, and concurrency.
Some notable updates:
🌐 HTTP/3 support (QUIC-based, lower latency, better reliability)
🧵 Structured Concurrency (Preview) for safer multithreading
⚡ JVM & GC optimizations improving startup and runtime performance
🧠 Continued evolution of pattern matching
🧪 Vector API (Incubator) for high-performance workloads
This release is less about flashy features and more about incremental improvements that impact real-world systems.

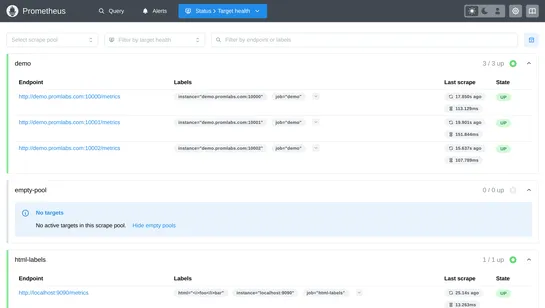
When to use Prometheus and when to look for other solutions.

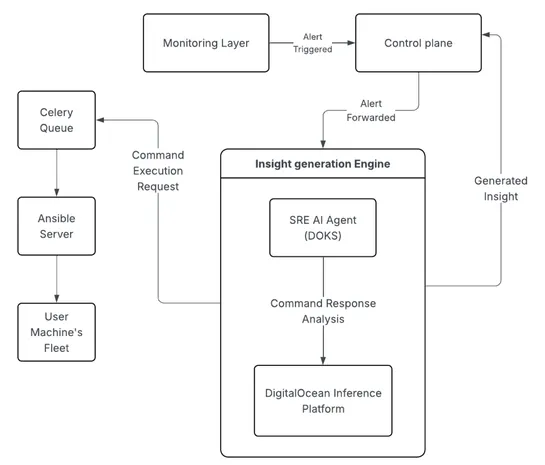
Scaling Autonomous Site Reliability Engineering: Architecture, Orchestration, and Validation for a 90,000+ Server Fleet


Anthropic's global AI study surveyed 80,508 participants across 159 countries, revealing desires for more personal time and concerns about AI's unreliability and job displacement. Sentiments vary regionally, with lower-income countries seeing AI as an equalizer, while Western Europe and North America focus on governance issues. The study highlights a complex mix of hope and fear regarding AI's impact.


At Slack, notifications were redesigned to address the overwhelming noise issue by simplifying choices and improving controls. The legacy system had complex preferences that made it difficult for users to understand and control notifications. Through a collaborative effort, the team refactored prefe.. read more

