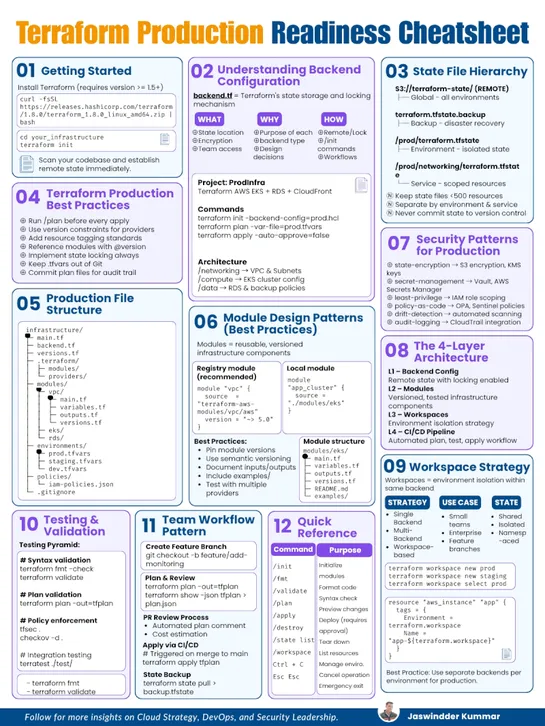
Terraform Production Readiness Cheatsheet
Terraform working isn’t enough. Learn what it takes to make it production-ready — from backend design to security and automated pipelines.
Join us
Terraform working isn’t enough. Learn what it takes to make it production-ready — from backend design to security and automated pipelines.
Hey, sign up or sign in to add a reaction to my post.
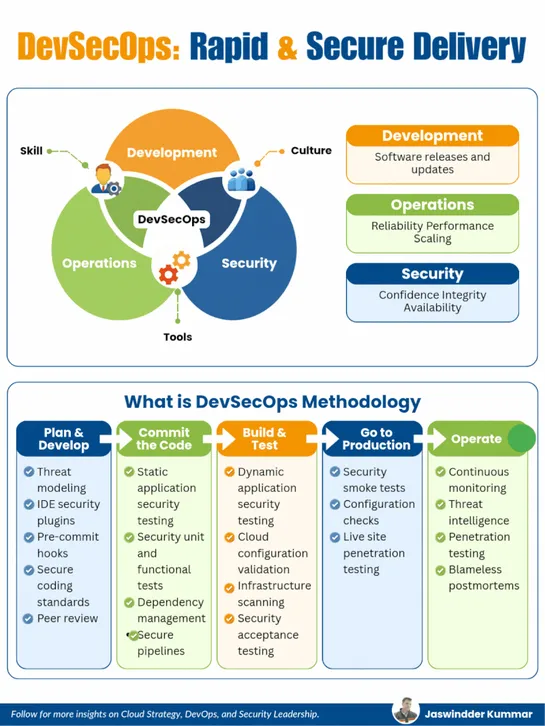
If security is your last step, you’re already too late. This guide shows how to build a DevSecOps pipeline where security is continuous, automated, and invisible to delivery speed.
Hey, sign up or sign in to add a reaction to my post.
The article catalogs obfuscation methods:HTML entities,SVG in an object,display:none, JavaScript decoders, custom encodings, andAES‑256. It coversmailtoobfuscation, redirects (302/301,.htaccess), interaction-gated reveals, accessibility caveats, and ahoneypot-based spam-statistics system... read more
Hey, sign up or sign in to add a reaction to my post.
SQLite packsJSONextraction, expression indexes,FTS5full-text search,CTEs, window functions, andWALinto a single file. It enforcesstrict tables, supportsgenerated columns, and indexes JSON expressions for fast semi-structured queries... read more
Hey, sign up or sign in to add a reaction to my post.
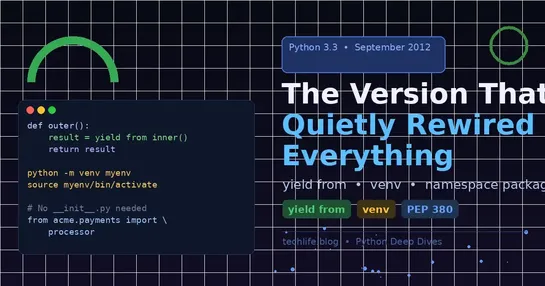
Python 3.3 introduced three key features that have had a lasting impact on Python development. Firstly, yield from simplified the composition of generators by allowing easy delegation between them. Secondly, venv standardized virtual environments in Python, improving isolation and reproducibility of.. read more
Hey, sign up or sign in to add a reaction to my post.
GitHub revoked Copilot's ability to inject tips into other users' pull requests after reports that Copilot Review inserted aRaycastlink. They disabled agent tips in PR comments, blamed a programming-logic bug, and said they won't turn tips into ads... read more

Hey, sign up or sign in to add a reaction to my post.
CTO at ZAR shares his experience managing 10 engineers, shipping code, and operating at the C-level with an AI assistant named Claude Code. The system allows him to maintain context across multiple workstreams, automate tasks, and scale his productivity. In just three weeks, he has documented 82 mee.. read more
Hey, sign up or sign in to add a reaction to my post.
The Kubernetes Monitoring Helm chart version 4.0 is designed to solve real pain points that users have hit as their monitoring setups have grown. Destinations are now defined as a map instead of a list, making it easier to manage configurations for multiple clusters. Collectors are defined by the us.. read more
Hey, sign up or sign in to add a reaction to my post.
Duolingo made a bold leap migrating 500+ services to Kubernetes, embracing Argo CD for blue-green deployments and leveraging GitOps for flexibility and control. This shift to a cellular architecture enabled them to isolate environments and manage developer trust while navigating AWS rate limits. Exc.. read more
Hey, sign up or sign in to add a reaction to my post.
Hey there! 👋
I created FAUN.dev(), an effortless, straightforward way for busy developers to keep up with the technologies they love 🚀
