The Human Infrastructure: How Netflix Built the Operations Layer Behind Live at Scale
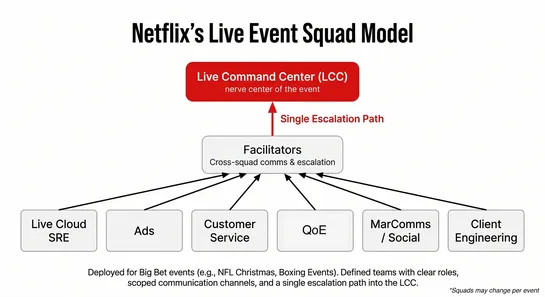
Netflix has massively scaled its live content, now streaming over nine shows per day with up to 17.9M peak viewers per game, thanks to a complex Broadcast Operations Center, strict transmission quality standards, and a tiered human operations model, including specialized engineering teams and dedica.. read more