Relabeling in Prometheus
Understanding Relabeling
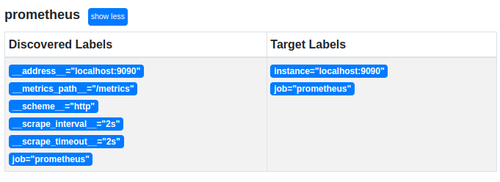
Prometheus uses a service discovery mechanism to automatically find targets and scrape their metrics. The discovered labels are metadata generated during this process, representing target-specific information such as instance names, ports, or service details. These labels can be relabelled or dropped based on your preferences.
Relabeling in Prometheus allows you to rewrite, modify, or filter labels associated with a target. This is useful for cleaning up label names, standardizing metadata, or controlling which targets are scraped.
To better illustrate how relabeling works, consider this configuration:
cat < /etc/prometheus/prometheus.yml
global:
  scrape_interval: 2s
scrape_configs:
  - job_name: prometheus
    static_configs:
      - targets: ['localhost:9090']
EOF
After reloading (kill -HUP $(pidof prometheus)), visit the Service Discovery page on your Prometheus server.
# You can execute the following command to get the URL of the "Service Discovery" page
echo http://$(curl -s ifconfig.me):9090/service-discovery
Service Discovery
Observability with Prometheus and Grafana
A Complete Hands-On Guide to Operational Clarity in Cloud-Native SystemsEnroll now to unlock all content and receive all future updates for free.

