Understanding Prometheus: Internals and Architecture
Prometheus Architecture
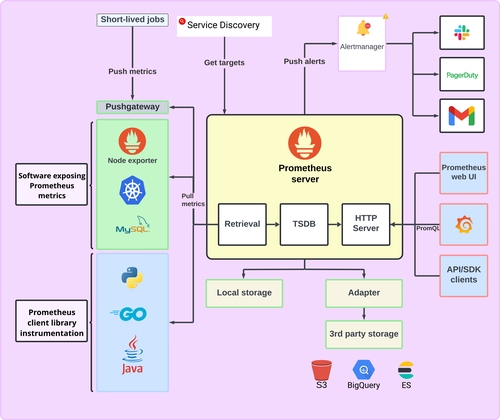
At the core of Prometheus is a robust, modular architecture that efficiently collects, stores, and queries metrics, while integrating with alerting, visualization, and storage tools.
Prometheus' strength lies in the quiet cooperation of components that make it whole:
- Prometheus Server: The central component that orchestrates the collection, storage, and querying of metrics.
- Pushgateway: An intermediary that allows short-lived jobs to push metrics to Prometheus.
- Exporters: Specialized components that expose metrics from various systems and services.
- Service Discovery: Mechanisms that automatically discover services and endpoints for monitoring.
- Client Libraries: Libraries that enable developers to instrument their applications and expose custom metrics.
- Storage Solutions: Options for storing metrics data, including local and remote storage.
- Prometheus User Interfaces: Interfaces for users to interact with the collected data.
How Prometheus works
The Server
The Prometheus server is the linchpin of the entire architecture, orchestrating the collection, storage, and querying of metrics. It performs several crucial functions:
Metrics Retrieval: The server is responsible for pulling metrics from various configured targets, a process also known as scraping. These targets can include applications, databases, and system components, each exposing metrics through an HTTP endpoint.
Time Series Database (TSDB): Once collected, the metrics are stored in a TSDB, optimized for high-performance storage and retrieval. This database allows Prometheus to efficiently manage vast amounts of metrics data.
HTTP Server: This component includes the Prometheus HTTP server, exposing the collected metrics and providing a query interface through PromQL. Users and systems can interact with the server to extract meaningful insights from the stored data using the web interface or the Prometheus API.
Pushgateway
Not all applications are conducive to the pull-based model that Prometheus primarily uses. For instance, short-lived jobs may terminate before Prometheus has a chance to scrape their metrics. To address this, the Pushgateway serves as an intermediary: Applications can push their metrics to the Pushgateway, which then holds these metrics for subsequent scraping by the Prometheus server. This is particularly useful for batch jobs or ephemeral instances that exist briefly but generate important metrics.
Exporters
Prometheus exporters are not part of Prometheus itself, but they are essential components in its ecosystem. They are specialized components designed to expose metrics from various systems and services. Each exporter acts as a bridge between the Prometheus server and the monitored target.
Here are some examples:
Observability with Prometheus and Grafana
A Complete Hands-On Guide to Operational Clarity in Cloud-Native SystemsEnroll now to unlock all content and receive all future updates for free.

