Monitoring Docker Swarm with Prometheus
Installation and Initial Configurations
Monitoring Docker Swarm is not very different from monitoring standalone Docker hosts. There are few additional components and nodes to consider but in essence, the process is similar. In a Docker Swarm cluster, we have multiple nodes (managers and workers) that are part of the cluster. They can be creaeted and destroyed dynamically along with the services running on them. A service discovery mechanism is needed to keep track of the different states of the cluster.
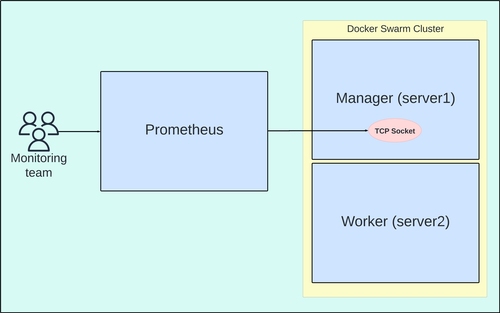
To understand how to monitor Docker Swarm with Prometheus, we are going to use the following setup:
monitoring: The server where Prometheus is running. It will be used to scrape metrics and store them.server1: The server where the Docker Swarm manager is running.server2: The server where the Docker Swarm worker is running.
Our cluster, in this case, is composed of one manager and one worker.
The following diagram shows the architecture of the setup:
Docker Swarm Monitoring
First, let's start by creating the cluster.
On server1:
Export the private IP address of server1.
export server1=
Initialize the Docker Swarm cluster using its private IP address:
docker swarm init --advertise-addr $server1
The command will output a join token that we will use to add the worker node to the cluster. It should look like this:
docker swarm join --token SWMTKN-1-.... :2377
Keep this command handy as we will need it in the next step. Move to server2 and install Docker if it's not already installed, then run the join command to add server2 to the cluster
# Install Docker on server2 if it's not already installed
curl -fsSL https://get.docker.com | VERSION=27.0 sh

# Join the cluster
docker swarm join --token SWMTKN-1-xxx-xxx :2377
Prometheus needs to discover the nodes in the the swarm dynamically. To achieve this, we need to configure the manager to expose the Docker socket remotely. This will allow Prometheus to connect to the Docker daemon on the manager node and discover the nodes in the cluster
Export the variable DOCKER_METRICS_ADDR that we will use to enable the metrics:
export server1=
export DOCKER_METRICS_ADDR=$server1:9323
Now, update the Docker daemon configuration file to enable the metrics and expose the Docker socket for discovery.
This is done on server1 (the manager node):
cat < /etc/docker/daemon.json
{
  "metrics-addr" : "${DOCKER_METRICS_ADDR}",
  "experimental" : true,
  "hosts": ["unix:///var/run/docker.sock", "tcp://$server1:2376"]
}
EOF
Once tcp://$server1:2376 is added to the hosts list, it allows remote connections to the Docker API on server1 (manager). This is required so that Prometheus can connect to the Swarm manager’s API for service discovery.
The actual metrics are scraped from the address defined in metrics-addr
Observability with Prometheus and Grafana
A Complete Hands-On Guide to Operational Clarity in Cloud-Native SystemsEnroll now to unlock all content and receive all future updates for free.

