Monitoring Docker Swarm with Prometheus
Configuring Prometheus
dockerswarm_sd_configs is a Prometheus service discovery configuration that automatically discovers scrape targets from a Docker Swarm cluster. It lets Prometheus dynamically find containers, services and other resources managed by Swarm without manual static target lists.
So, instead of defining static targets like this:
scrape_configs:
- job_name: 'docker'
static_configs:
- targets: [':9323' , ':9323' ]
We define a dynamic configuration that uses the Docker Swarm API to discover the nodes and services in the cluster:
scrape_configs:
  - job_name: 'docker_swarm'
    dockerswarm_sd_configs:
      - host: http://:2376
        role: nodes
Where host is the address of the Docker daemon on the manager node, and role specifies what kind of resources to discover (nodes, tasks, services, etc.).
Let's implement this.
On monitoring, export the IP address of server1:
export server1=
Update the configuration file to scrape the metrics from the daemon on the manager node and discover the nodes in the cluster:
cat << EOF > /etc/prometheus/prometheus.yml
global:
  scrape_interval: 15s

scrape_configs:
  - job_name: 'docker_swarm'
    dockerswarm_sd_configs:
      - host: http://$server1:2376
        role: nodes

    relabel_configs:

      # First action: Use the node address as the target address
      # and append the port 9323 where the metrics are exposed
      # => This will tell Prometheus to scrape the metrics from each node
      # on the port 9323
      - action: replace
        source_labels: [__meta_dockerswarm_node_address]
        target_label: __address__
        replacement: \${1}:9323

      # Second action: Use the node hostname as the instance label
      - action: replace
        source_labels: [__meta_dockerswarm_node_hostname]
        target_label: instance
EOF
This dockerswarm_sd_configs configuration in Prometheus is used to specify the Docker Swarm service discovery settings.
This section is important to enable Prometheus to automatically discover and scrape metrics from the nodes within the cluster.
We also used http://$server1:2376 in host to specify the address of the Docker daemon on the manager node and nodes in role to discover all nodes in the cluster.
The tcp://$server1:2376 endpoint is where the Docker daemon is listening for remote connections, we already configured this in a previous step on server1:
"hosts": ["unix:///var/run/docker.sock", "tcp://$server1:2376"]
The relabel_configs section is used to apply some transformations before scraping.
The first one sets the __address__ which is the address of the target to scrape to the address of the discovered node with the port 9323 appended to it:
- action: replace
  source_labels: [__meta_dockerswarm_node_address]
  target_label: __address__
  replacement: $1:9323
The second one sets the instance label to the hostname of the discovered node:
- action: replace
  source_labels: [__meta_dockerswarm_node_hostname]
  target_label: instance
We can now move to the second node (server2) and enable the metrics there as well.
On server2, export the IP address of server2 (private IP in our case):
export server2=
Set the DOCKER_METRICS_ADDR variable used to enable the metrics on server2:
export DOCKER_METRICS_ADDR=$server2:9323
Update the daemon configuration file to tell Docker to expose the metrics on the specified address:
cat < /etc/docker/daemon.json
{
  "metrics-addr" : "${DOCKER_METRICS_ADDR}",
  "experimental" : true
}
EOF
Reload the Docker daemon:
systemctl restart docker
On monitoring, check if everything is working:
# Reload Prometheus configuration
kill -HUP $(pgrep prometheus)

# Service discovery info
export server1=
curl -s http://$server1:2376/nodes | jq

# Metrics from server1
export server1=
curl http://${server1}:9323/metrics

# Metrics from server2
export server2=
curl http://${server2}:9323/metrics
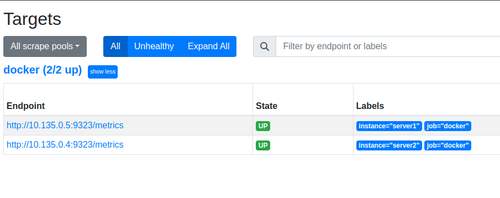
If you go to the list of targets on the Prometheus web interface, you should see both cluster nodes listed as targets.
The endpoint column shows the address of each node with the port 9323 appended to it, which is where the metrics are exposed.
Prometheus Targets
At this point, we used role: nodes in the dockerswarm_sd_configs configuration which means that Prometheus is using
We can also use /tasks to discover the tasks (containers), and with the help of cAdvisor, you can get more detailed metrics about them. To do this, we need to create a service that runs cAdvisor on each node.
In the following command, we are running a global cAdvisor service in the cluster. You should run the command on the manager (server1) node:
docker service create \
  --name cadvisor \
  -l prometheus-job=cadvisor \
  --mode=global \
  --publish target=8080,mode=host \
  --mount type=bind,src=/var/run/docker.sock,dst=/var/run/docker.sock,ro \
  --mount type=bind,src=/,dst=/rootfs,ro \
  --mount type=bind,src=/var/run,dst=/var/run \
  --mount type=bind,src=/sys,dst=/sys,ro \
  --mount type=bind,src=/var/lib/docker,dst=/var/lib/docker,ro \
  gcr.io/cadvisor/cadvisor:v0.52.0
> ℹ️ The `-docker_only` flag is used to run cAdvisor in Docker-only mode. This mode is used to disable the collection of machine-level metrics and focus only on container-level metrics.ℹ️ The
--mode=globalflag is used to ensure that the service runs exactly one task on each node in the cluster.
After creating the service, you can check the metrics endpoint:
curl http://$server1:8080/metrics
You should see a list of metrics related to the containers running on the node.
We can now update the Prometheus configuration to discover the tasks (containers) in the cluster using the tasks role. This is how we can do it:
- job_name: 'docker_tasks'
  dockerswarm_sd_configs:
    - host: http://$server1:2376
      role: tasks

  relabel_configs:

    # Only keep containers that should be running.
    - action: keep
      source_labels: [__meta_dockerswarm_task_desired_state]
      regex: running

    # Only keep containers that have a prometheus-job label.
    - action:
Observability with Prometheus and Grafana
A Complete Hands-On Guide to Operational Clarity in Cloud-Native SystemsEnroll now to unlock all content and receive all future updates for free.

