Building Grafana Dashboards for Node Exporter Metrics
The Node Exporter Full Dashboard
To visualize the metrics collected by the Node Exporter more easily, you can use the pre-built "Node Exporter Full" dashboard from Grafana's dashboard repository. This dashboard has the ID 1860 and is widely used for monitoring system metrics.
Start by importing it using its ID. Select Prometheus as the data source if you are prompted to do so, and click Import.
The imported dashboard contains more than 115 panels that display various system metrics like CPU, memory, disk, network, and filesystem usage. You can filter the data by hostname to view the metrics of a specific host.
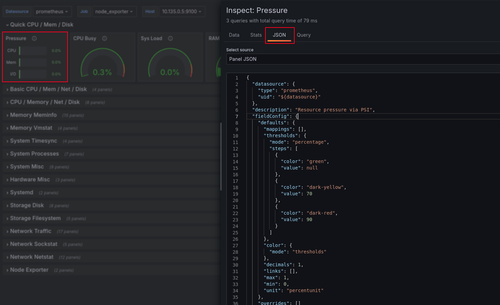
To customize the view, you have the option of editing the JSON configuration of the dashboard. To do this in Grafana, click on Edit > Settings > JSON Model. You can also do the same thing at the level of individual panels. This can be done by clicking the 3 dots in the top-right corner of a panel, then Inspect > Panel JSON.
Grafana Panel Inspector
If you look at the JSON definition of a panel, you will see that it contains everything you need to customize it, like the PromQL query. For example, if you want to change the query of a panel, you can edit the expr field within the targets array.
The following is an example PromQL query for CPU pressure that you can adapt to your specific needs:
irate(
  node_pressure_cpu_waiting_seconds_total{
    instance
Observability with Prometheus and Grafana
A Complete Hands-On Guide to Operational Clarity in Cloud-Native SystemsEnroll now to unlock all content and receive all future updates for free.
Hurry! This limited time offer ends in:
To redeem this offer, copy the coupon code below and apply it at checkout:

