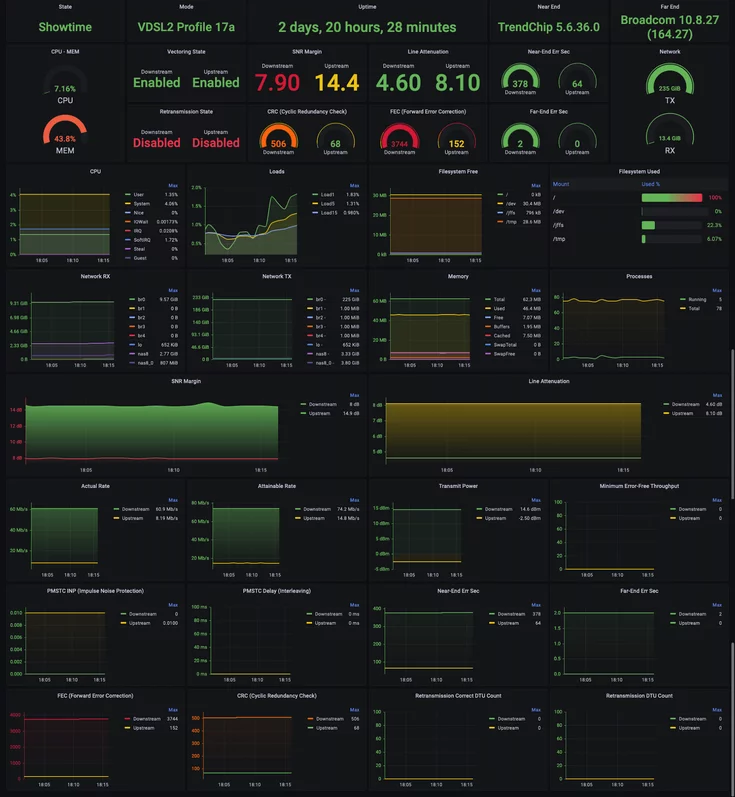
- Faced with frequent internet outages, he devised a solution to scrape xDSL metrics from his modem using Grafana Cloud.
- He also used Prometheus Exporter to bridge the gap between Prometheus and applications that don't export metrics in Prometheus format.
- The result was a comprehensive Grafana dashboard displaying important values like SNR Margin, Line Attenuation, and packet drops, which proved invaluable for troubleshooting his internet connectivity issues.


Give a Pawfive to this post!
Share with your friends and followers
Start writing about what excites you in tech — connect with developers, grow your voice, and get rewarded.
Join other developers and claim your FAUN.dev() account now!