Amazon OpenSearch Service: The Only Tutorial You Need
Discover how to set up, optimize, and use Amazon OpenSearch Service with this comprehensive, step-by-step tutorial.

Discover how to set up, optimize, and use Amazon OpenSearch Service with this comprehensive, step-by-step tutorial.

This blog post compares Datadog and Dynatrace, two leading monitoring solutions.
Datadog excels in breadth, offering comprehensive monitoring across infrastructure, applications, logs, and more. It boasts a user-friendly interface and extensive integrations.
Dynatrace specializes in AI-powered application performance monitoring, particularly strong in cloud-native environments. It provides deep insights and automated analysis, but can have a steeper learning curve.
The best choice depends on your specific needs, including monitoring priorities, application complexity, budget, and team expertise.
OpenTelemetry profiling helps you explore app performance, pinpointing issues and improving efficiency for better, more reliable apps.

Learn what the Apdex score is, how to calculate it, and its limitations. A quick guide to measuring user satisfaction effectively.

This comprehensive guide explores severity level classification in IT incident management. The article breaks down the five-tier severity system (SEV 1-5), explaining how to differentiate between critical and major incidents. Key highlights include:
Detailed explanation of severity levels from critical (SEV 1) to trivial (SEV 5)
Factors affecting severity classification including user impact, system complexity, and business criticality
Step-by-step implementation guide for effective severity level classification
Integration of SLIs and SLOs in incident classification
Best practices for automated classification systems
Business benefits including improved response times and enhanced continuity
Learn how to automate and manage your tasks efficiently with the Laravel Scheduler, making repetitive processes easier to handle in your app.

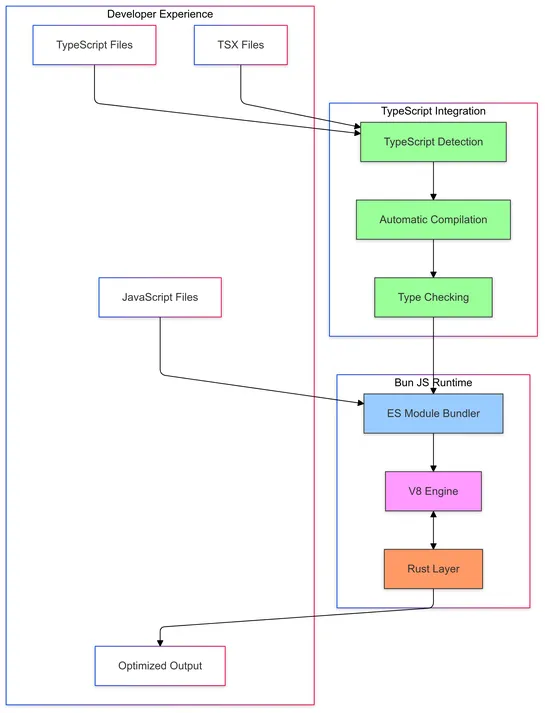
Learn how to quickly get started with Bun.js, a fast and efficient JavaScript runtime, and optimize your development workflow.
Learn how to configure Serilog, handle errors, and explore best practices for effective logging in your .NET applications.

SLF4J offers flexibility with multiple logging frameworks, while Log4j provides rich features for detailed, high-performance logging.


This comprehensive guide compares two leading monitoring platforms: Datadog vs New Relic. The analysis covers essential aspects of both tools, helping teams make an informed decision based on their specific needs.
Key Highlights:
Monitoring Capabilities: Datadog offers strong infrastructure monitoring with real-time metrics tracking, while New Relic excels in application performance monitoring and code-level insights.
Integration Support: Both platforms provide extensive third-party integrations (Datadog: 600+, New Relic: 650+), covering major cloud providers, databases, and development tools.
User Experience: Both tools feature modern, intuitive interfaces with customizable dashboards and visualization options, catering to different user preferences.
Target Users: Datadog is ideal for DevOps and SRE teams focusing on infrastructure, while New Relic better serves development-focused teams needing deep application insights.
Pricing Models: Datadog uses host-based pricing with feature add-ons, while New Relic employs a data ingestion-based model with tiered pricing plans.
The comparison reveals that while both platforms offer robust monitoring solutions, their strengths lie in different areas. Datadog shines in infrastructure monitoring and operational insights, making it suitable for operations-focused teams. New Relic's strength in application performance monitoring and developer tooling makes it an excellent choice for development-centric organizations.

