Join us
@phicygni ・ Feb 03,2022 ・ 6 min read ・ 3k views ・ Originally posted on blog.devgenius.io


Need help setting up a monitoring system? Here’s a complete, easy to deploy, dockerised monitoring system for a local development environment with email alerts.
The open source software Prometheus is an effective and reliable way of monitoring a software service like a web application. It will monitor your service and notify you when it goes down. In addition Prometheus also collects numerous kinds of metric data from the target for diagnostics and display purposes. Presented below is a convenient and reliable docker compose script with a complete ensemble of components useful for running a complete Prometheus monitoring system in a local environment for evaluation and integration testing purposes. Be operational with one docker command. Included in the compose design are containers for Prometheus, Prometheus Alertmanager, Mailhog (a test SMTP server) and some Python code acting as a target to be continuously monitored. Prometheus is also able to monitor code developed in Node, Java, Ruby, Go, Rust, C++, C# and PHP to name a few [3]. Easily update the compose script to incorporate your particular service to be monitored.
I recently worked on a project where I designed and implemented a web application for a client. To evaluate the stability of said web application I felt it important to monitor the service over time and have a mechanism to notify me when it goes down. After doing some cursory research I became aware of the open-source monitoring software Prometheus, a toolkit useful for monitoring services and sending alerts when they go down [1].
According to the Git repo: “Prometheus, a Cloud Native Computing Foundation project, is a systems and service monitoring system. It collects metrics from configured targets at given intervals, evaluates rule expressions, displays the results, and can trigger alerts when specified conditions are observed [2].”
Sounds good so far but will it cover my specific requirements? The features I required were:
Preliminary research indicated the Prometheus software will meet all my requirements and is also very well regarded in the industry. However, I wanted a way to evaluate its functionality on my local development machine before deploying it to the cloud. Presented below is docker compose based design I created to evaluate Prometheus and also get an idea of how a client library could be integrated into a target service. In the end, my evaluation tests showed Prometheus is very well suited for monitoring and the docker-compose script I created is very useful not only showing Prometheus’ overall ability to know when a service is down but also to have a test environment to:
In the sections to follow we describe the docker compose design for this monitoring and alert system, explain how to use it and finally how it is suited to also process and display custom metric information.
Below is the docker compose script. It is part of the complete Github repo which one can find here.
The docker compose script incorporates the following images:
All containers are connected though a shared bridge network as shown in the diagram below:
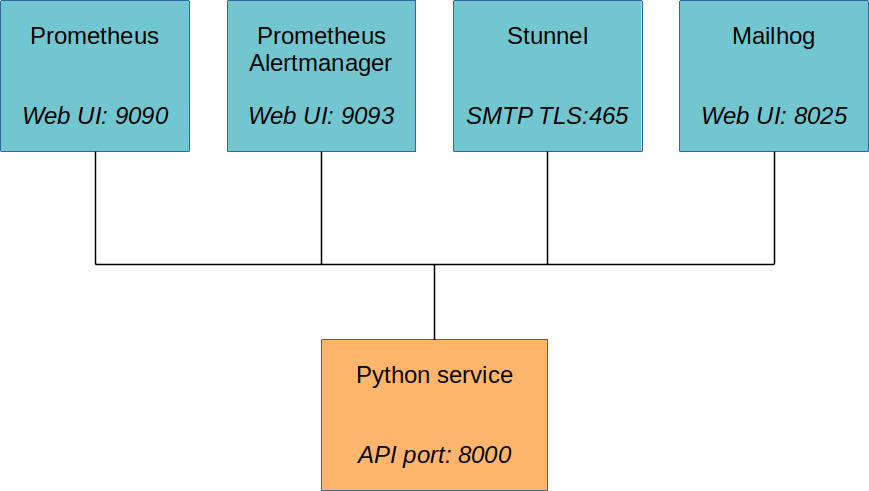
These are the containers of the docker compose script connected to a bridge network.
The Prometheus container is responsible for continuously monitoring the target service to determine if it is still running and to also collect additional metric information. When it detects the service as being down, an alert is generated which is then sent to the Prometheus Alertmanager container for notification processing.
The Prometheus Alertmanager container is responsible for processing alerts generated by Prometheus and producing email notifications.
Stunnel is a proxy designed to add TLS encryption functionality to existing clients and servers without any changes in the programs’ code [4]. It is necessary because Mailhog (the SMTP server) only supports unencrypted SMTP functionality at present [5]. The Prometheus Alertmanager will send an email to Mailhog via this Stunnel proxy.
Mailhog is a test SMTP server complete with a web UI which makes it very convenient. It is trivial to set up and the perfect SMTP server for this application. I wrote a more detailed article about Mailhog previously and can be found here.
Finally we have the Python container running the target service we want to monitor. For the evaluation test Python code was produced to act as a target service for monitoring. The official Python client library was integrated with the code and the appropriate functions called to serve metric information for monitoring. Find the source as part of the repo here.
To check out the repo type the following:
Change the directory to the one just checked out:
To build and run the docker containers type the following:
All the containers will be created and started as well. The following ports have been exposed for usage:
| Port | Description | URL |
|---|---|---|
| 9090 | Prometheus Web UI | http://localhost:9090 |
| 9093 | Prometheus Alertmanager Web UI | http://localhost:9093 |
| 8025 | Mailhog Web UI | http://localhost:8025 |
| 8000 | Python client Prometheus metric API | http://localhost:8000 |
To stop the containers type the following:
In Linux to stop and remove all the containers type the following:
In Windows to stop and remove all containers type the following:
The Prometheus container continuously monitors the Python target service and generates an alert when it goes down. One can induce a target down event by stopping the Python service by means of the command:
Active alerts is shown on the Prometheus UI as in this screen capture:

The Prometheus UI shows the target service as being down.
From here there are several steps which need to happen before an email is generated. The diagram below shows how a Prometheus alert finally translates into getting a notification email:

The flow between containers when an email is generated.
The four steps in the diagram above can be described as:
(1) After the target service goes down, Prometheus will generate an alert and send it to the Alertmanager container via port 9093.
(2) The Alertmanager reacts to the alert by generating an SMTP email and sending it to Stunnel container via port SMTP TLS port 465.
(3) The Stunnel forwards the unencrypted SMTP email to the Mailhog container via port 1025.
(4) The Mailhog container receives the unencrypted SMTP email and displays it on its Web UI.
Alerts received by the Alertmanager will be shown on its UI as in this screen capture:

The Alertmanager UI shows the service as being down.
An example of an alert email notification received by Mailhog is shown in the screen capture below:
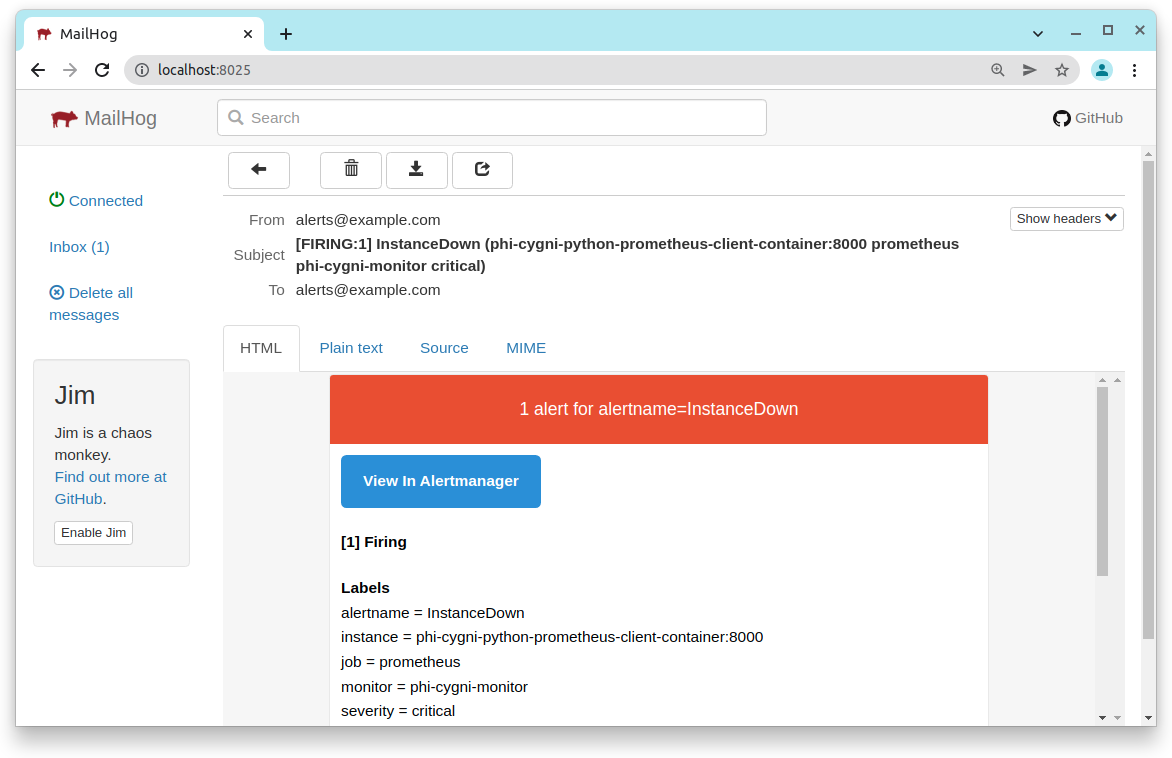
An instance down email alert as received on Mailhog.
Apart from monitoring if services are down, Prometheus also collects and display various kinds of metric information. This screen capture shows the Prometheus UI displaying the CPU temperature as captured from the target Python service:

Prometheus displays the CPU temperature information as a graph.
One can also monitor custom metrics by calling the appropriate client library functions in the target service. For demonstrative purposes I designed the target Python code to generate a floating point value from a sinusoidal function for display over time. It is a completely arbitrary example but demonstrates the functionality. Shown below is a screen capture from the Prometheus UI showing the custom metric as a graph.
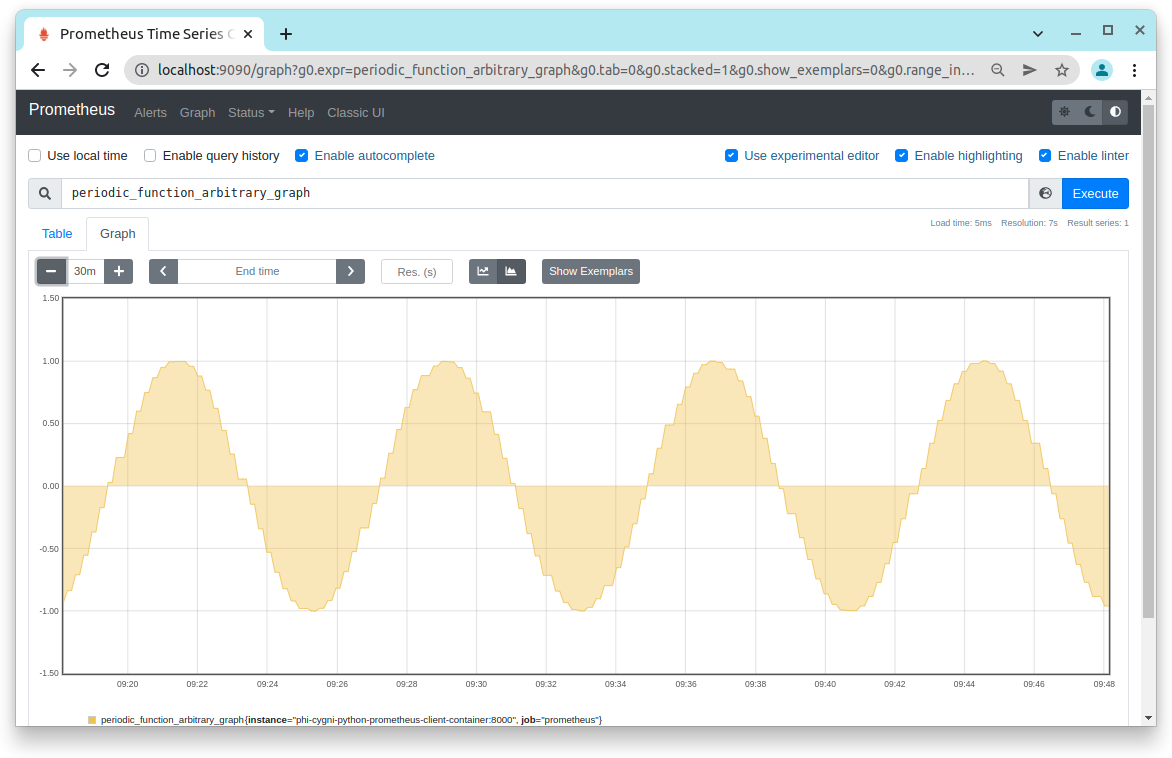
A graph of an arbitrary custom metric generated by the Python target service.
It should also be noted Prometheus usage is not limited to monitoring Python code. Prometheus also provides official libraries for the Go, Java, Scala, Ruby and Rust languages. In addition to those there are also unofficial third-party client libraries for Bash, C, C++, Common Lisp, Dart, Elixir, Erlang, Haskell, Lua, C#, Node (Javascript), OCaml, Perl, PHP and R [3]. Prometheus, therefore, will be compatible with almost any kind of code requiring monitoring.
Prometheus is well respected enterprise level monitoring service and the docker compose script presented above incorporates it into a complete and easy to use monitoring system which includes email alerts. The design and usage of the script was explained in addition to showing how email alerts are generated when a target service goes down. Examples of metric information displayed via the Prometheus Web UI were also shown. From here users can easily modify the composer script to incorporate their own specific services for monitoring. The dockerised design of the monitoring system means it can be rapidly deployed, is reproducible and also provides a convenient development environment to tweak monitoring parameters, evaluate alert generation as well as the do the necessary integration with regards to the collection diagnostic metric information.
[2]: https://github.com/prometheus/prometheus
Share with your friends and followers
Join other developers and claim your FAUN account now!


Influence
Total Hits
Posts

Hand curated newsletters for Developers, private Slack with like minded people, podcasts, job offers, news and more!


Only registered users can post comments. Please, login or signup.