How to Collapse Your Stack Using PostgreSQL for Everything
What Postgres for Everything means to a dev deploying all sorts of databases. Spoiler: it’s about collapsing your stack and keeping it simple... read more

What Postgres for Everything means to a dev deploying all sorts of databases. Spoiler: it’s about collapsing your stack and keeping it simple... read more

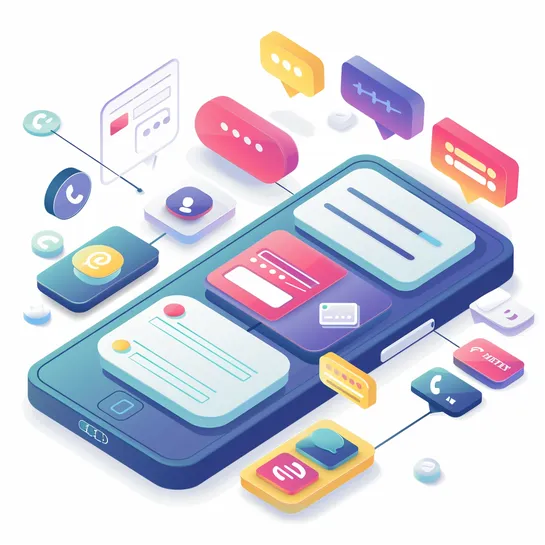
Setting up a phone number for clients to schedule meetings is straightforward with the right tools like Twilio for phone number management and AWS for hosting in a Serverless Architecture. Express and ngrok are used for local development and testing... read more
Simon Tatham's guide focuses on writing effective commit messages, highlighting the importance of including information on the intended change, side effects, reasons for the change, and related future work. He emphasizes the value of making commit messages informative and clear for various readers, .. read more
Brain-chip startup has proposed solutions for thread pullout problem experienced by first participant, Noland Arbaugh.. read more
Changes to Elasticsearch architecture enable vector search and generative AI, with autoscaling for indexing and search. Serverless deployment means no more manual version upgrades. Expanded support for AWS, Azure, and Google Cloud... read more

The Worst Website In The Entire World is owned by Broadcom.. read more

CI/CD observability provides insights into the performance and health of CI/CD pipelines, helping teams detect issues early and improve efficiency. A few options are currently available on the GitHub Actions marketplace to integrate OpenTelemetry into CI/CD workflows... read more

Announcing the Docker extension for GitHub Copilot (@docker), a plugin that extends GitHub Copilot's technology to assist developers in working with Docker... read more


This blog post explores monitoring tools used by DevOps engineers and SREs to maintain IT infrastructure health and ensure service reliability. It covers the three main types of monitoring tools (network, server, application performance), factors to consider when choosing a tool, and provides a list of popular options including Prometheus and Zabbix.
The importance of incident management is also addressed, highlighting Squadcast as a tool that integrates with monitoring tools to streamline the incident resolution process. By combining monitoring and incident management, teams can effectively respond to issues and minimize downtime.
Overall, the blog emphasizes selecting the right tools to gather the necessary data for optimizing IT infrastructure performance and ensuring a positive user experience.
This blog post explains the concepts of SLAs, SLOs, and SLIs, all of which are important for measuring and ensuring service quality.
SLI (Service Level Indicator): A measurable value that reflects how well a service is performing. Common examples include uptime, latency, error rate, and throughput.
SLO (Service Level Objective): A target value for an SLI. It essentially defines the desired level of service quality.
SLA (Service Level Agreement): A formal agreement between a service provider and its customers that outlines the service quality guarantees, often based on SLOs. SLAs typically involve penalties if the SLOs are not met.
The blog post also highlights the benefits of SLOs and provides best practices for implementing SLAs and SLOs. Some key takeaways include:
SLOs help teams collaborate and set measurable goals for service quality.
SLAs should be transparent and based on realistic SLOs.
It's better to start with simpler SLOs and gradually increase complexity.
Timing of outages can significantly impact customer satisfaction.
By understanding these concepts, organizations can establish a framework to deliver high-quality services and maintain a competitive edge.

